See ModPageSpeed optimize real sites
Four real sites — an e-commerce store, a blog, a news portal, and a portfolio — each built from original, unoptimized assets. ModPageSpeed 2.0 cuts total page weight by 48–69% across them; on the image-heavy store, AVIF transcoding alone takes the catalog images from 99.7 KB down to 23.7 KB (76% smaller). Every number below is measured.
This is ModPageSpeed 2.0 optimizing whole sites from its worker behind nginx. mod_pagespeed 1.15 takes the other approach: a native module inside Apache, nginx, or IIS, with granular per-filter control so you switch each optimization on or off yourself. See that filter-by-filter on the filter examples.
About this demo's optimization baseline
These pages ship deliberately unoptimized assets so ModPageSpeed 2.0 has real work to do: CSS is verbose with longhand properties, JavaScript is unminified, and images are served as uncompressed JPEGs.
Optimization analysis
Real measurements from the demo sites above, produced by the actual ModPageSpeed 2.0 nginx + worker + cache stack. CSS/JS sizes are measured before and after minification, image sizes are measured before and after transcoding to WebP and AVIF.
Total page weight
−69%
smaller
112.1 KB → 34.7 KB
Load time (3G)
−56%
faster
1.8s → 0.8s
Lighthouse Performance
+34
points Good (≥90)
56 → 90
Resource breakdown
| Resource | Original | Optimized | Saving | Bar |
|---|---|---|---|---|
| CSS (minified) | 6.7 KB | 4.5 KB | -34% |
|
| JavaScript (minified) | 2.4 KB | 1.5 KB | -39% |
|
| Images (6x JPEG) → WebP | 97.3 KB | 27.1 KB | -72% |
|
| Images (6x JPEG) → AVIF | 97.3 KB | 23.1 KB | -76% |
|
| HTML + critical CSS | 5.6 KB | 5.6 KB | 0% | |
| Total | 112.1 KB | 34.7 KB | -69% |
Before — original resources
After — optimized with AVIF
CSS minification example
Actual code from the e-commerce store demo. Comments removed, whitespace stripped, shorthand properties collapsed.
Before — 6.7 KB
                    /* ===== ShopGrid E-Commerce - Verbose CSS for PageSpeed 2.0 Demo ===== */

/* Reset: remove default browser margins and use border-box */
* {
  margin: 0;
  padding: 0;
  box-sizing: border-box;
}

/* Color palette: warm amber accent on clean neutrals */
:root {
  --primary: #e67e22;
  --primary-dark: #d35400;
  --text-dark: #2c3e50;
  --text-muted: #7f8c8d;
  --text-light: #bdc3c7;
  --bg-white: #ffffff;
  --bg-light: #f8f9fa;
  --bg-dark: #2c3e50;
  --border: #ecf0f1;
  --shadow: 0 2px 8px rgba(0, 0, 0, 0.08);
  --shadow-hover: 0 4px 16px rgba(0, 0, 0, 0.12);
}

/* Base: system font stack for performance */
body {
  font-family: -apple-system, BlinkMacSystemFont, 'Segoe UI', Roboto, sans-serif;
After — 4.5 KB
*{margin:0;padding:0;box-sizing:border-box} :root{--primary:#e67e22;--primary-dark:#d35400;--text-dark:#2c3e50;--text-muted:#7f8c8d;--text-light:#bdc3c7;--bg-white:#ffffff;--bg-light:#f8f9fa;--bg-dark:#2c3e50;--border:#ecf0f1;--shadow:0 2px 8px rgba(0,0,0,.08);--shadow-hover:0 4px 16px rgba(0,0,0,.12)}body{font-family:-apple-system,BlinkMacSystemFont,'Segoe UI',Roboto,sans-serif;font-size:16px;lin
Methodology
We separate what we directly measure from what we model. The byte sizes below are measured from the actual ModPageSpeed 2.0 optimization pipeline running against the demo sites above — real pipeline output, not marketing math. The load-time and Lighthouse figures are projections we derive from those measured savings, and we say so explicitly.
Directly measured
-
CSS/JS sizes are measured by fetching the external
style.cssandapp.jsfiles from the origin server (before) and from the PageSpeed nginx proxy (after). Minified sizes reflect our actual CSS/JS minifier output. - Image sizes are measured by fetching each JPEG from the origin and the corresponding WebP and AVIF variants from the PageSpeed proxy. Totals are the real sum of all images per demo site.
Modeled from those measurements
- Load times are a model, not a stopwatch reading: we project transfer time for a simulated 3G connection (1.6 Mbps, 300ms RTT) from the measured total transfer size.
- Lighthouse scores shown here are projected from the measured resource savings and critical CSS injection, not captured from a live audit. For a live audit of your own site, use our analyzer — it runs Google's PageSpeed Insights and maps each finding to the ModPageSpeed filter that fixes it.
Measurements generated: May 29, 2026
See the live consoles
Both products ship a built-in console for monitoring and cache inspection. These are real, publicly reachable instances running on our own infrastructure — open them and click around.
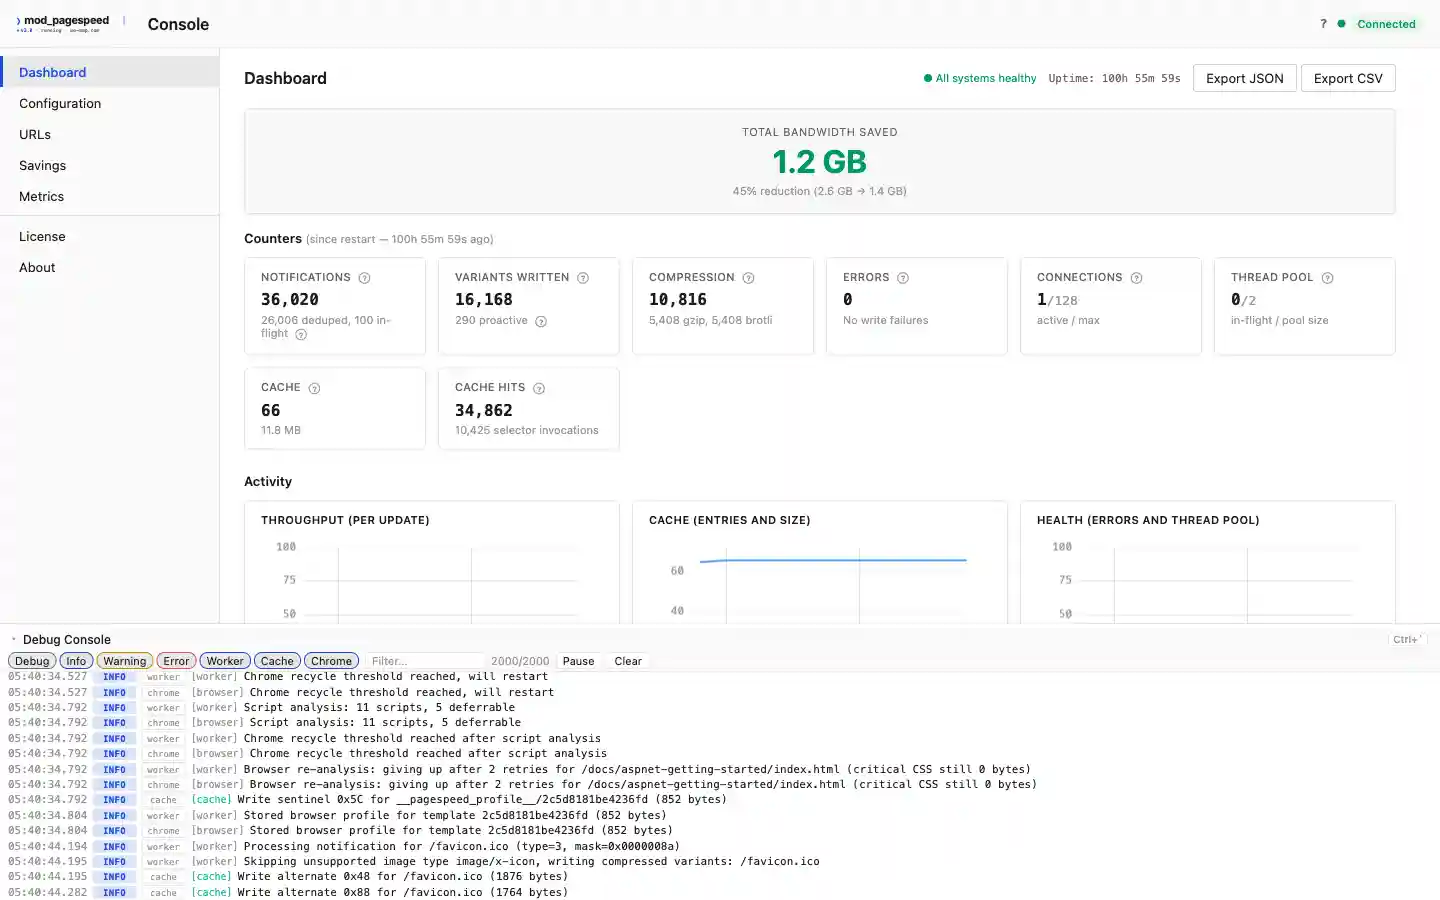
ModPageSpeed 2.0 console
A read-only dashboard with live optimization stats from this site's own production deployment. Open the live 2.0 console →
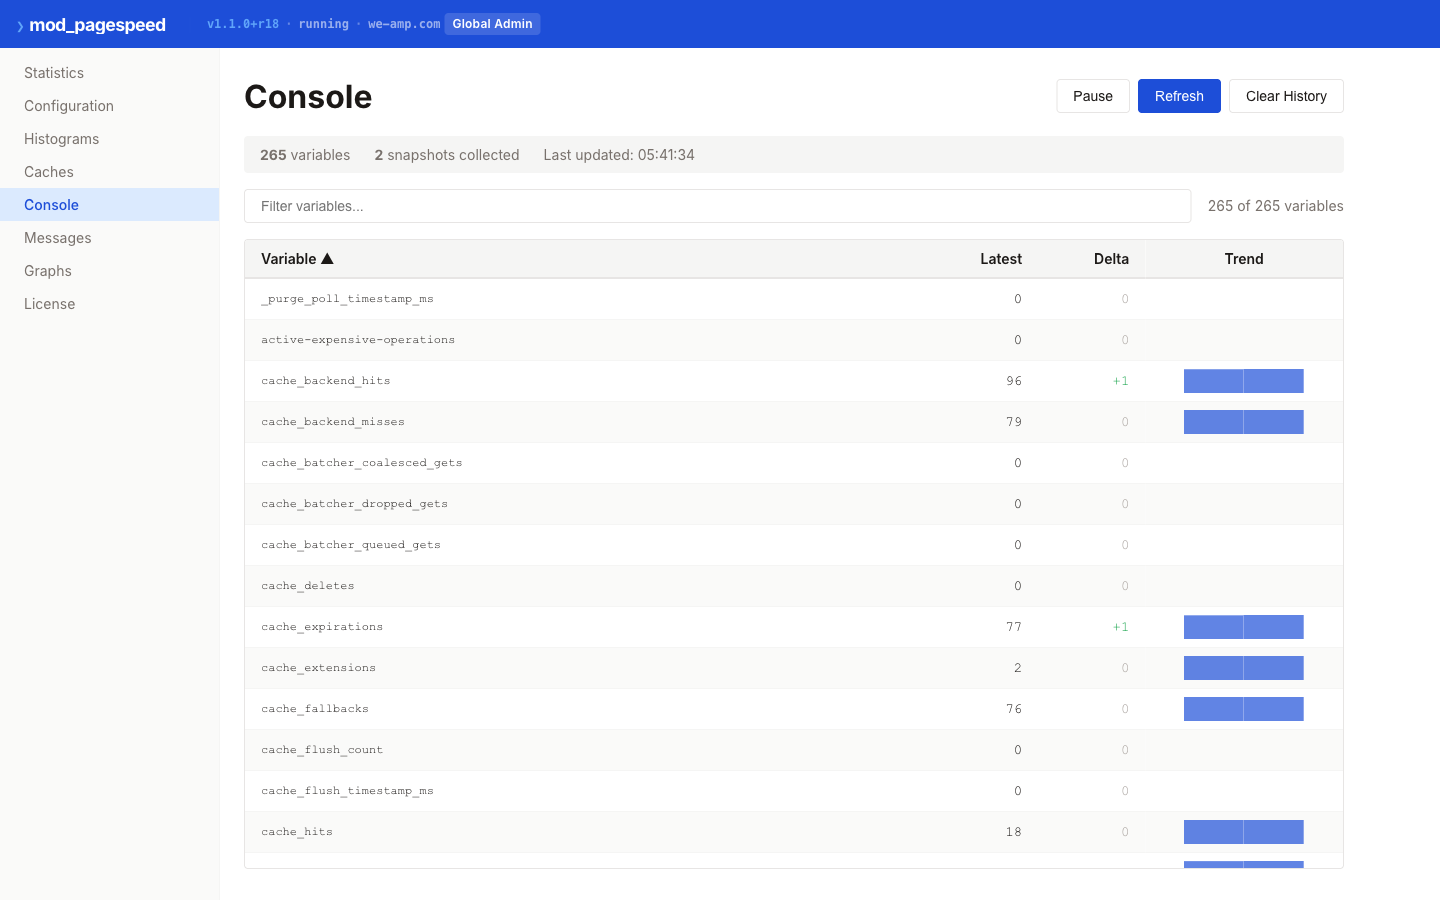
mod_pagespeed 1.15 admin console
The admin console built into the native module, running on our public Apache demo. Live statistics, caches, histograms, and message history, served in-process with no separate worker. Open the live 1.15 console →
Verify on your own content
Run ModPageSpeed 2.0 locally with Docker and measure the difference on your own site.
Quick start:
docker compose -f deploy/docker-compose.yml up -d
curl -I http://localhost:8080/          # X-PageSpeed: MISS (original)
sleep 2                                 # Wait for worker optimization
curl -I http://localhost:8080/          # X-PageSpeed: HIT  (optimized)
See the getting started guide for full installation instructions.
$99/site/month. See these results on your own site.
Production use requires a commercial license — but the software never locks you out.