Use the web console
Last updated Edit this page View as Markdown
Inspect cache contents, monitor live throughput and bandwidth savings, and hot-reload configuration from the mod_pagespeed 2.1 web console at /console/.
On this page
The web console is a SvelteKit application served directly by the worker
at /console/. It connects to the worker’s HTTP API over WebSocket and REST,
giving you real-time visibility into what the optimizer worker is doing on your
server.
The console runs on the same machine as your worker and is accessible only from your network. It loads no third-party scripts and makes no outbound network requests.
Accessing the console
Start the worker with the --api-port flag:
factory_worker --cache-path /data/cache.vol --api-port 9880Then open http://<your-server>:9880/console/ in a browser.
If you configured an API token (--api-token or PAGESPEED_API_TOKEN env var),
the console prompts for it on first load and stores it in the browser’s session
storage.
Public demo mode
To expose the console as a read-only public dashboard, add --api-read-open
to the worker. Concretely, this makes the following readable without the
token: the cached-URL inventory and per-URL variant detail, the origin hosts
and content types behind them, the active cooldown table, overall
stats/metrics, the current hot-reloadable config, and the live stats/events
WebSocket streams. The optimizer log is the one exception: GET /v1/logs
and the /v1/ws/logs stream still ask for the token — sent as the stream’s
first message — because log lines can carry the URLs, origin hosts and
error text of every site the optimizer serves. Mutating operations (config
changes, cache purge, browser captures) always require the token. The
console shows a login prompt only when a write operation is attempted.
Because this is still real operational data about your sites, only turn
on --api-read-open behind a reverse proxy that does its own
authentication (e.g., allow/deny by IP, or a proxy-level login) rather
than exposing it directly to the internet.
Console pages
The console has nine pages, accessible from the sidebar navigation.
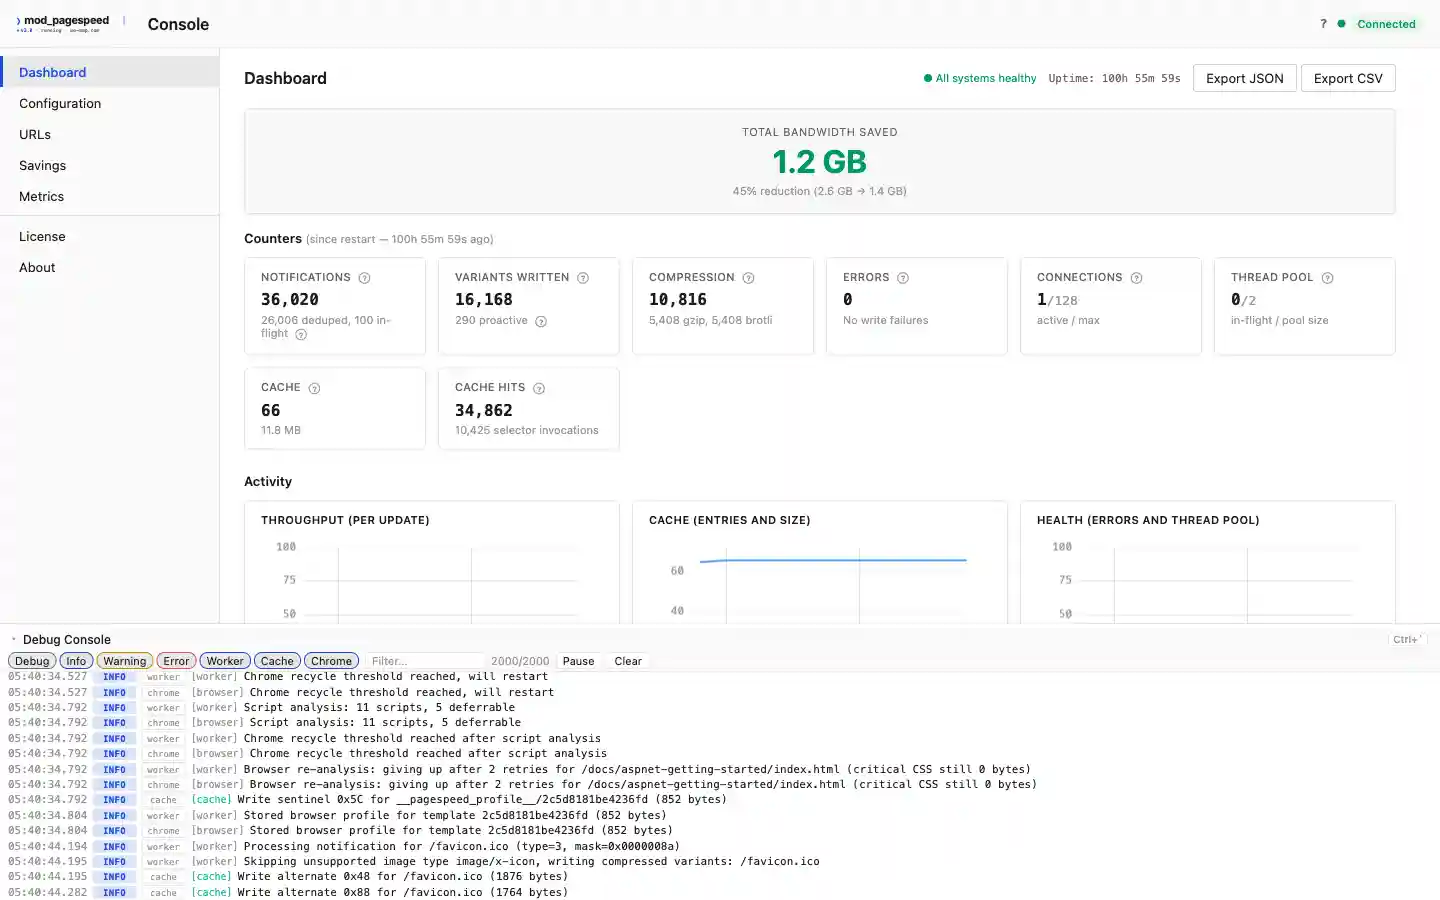
Dashboard (/)
The landing page. Shows:
- Health summary with a status indicator (green/yellow/red) and uptime
- Key metric cards — notifications received, variants written, compression counts, errors, active connections, thread pool utilization, cache entries, and cache lookup invocations
- Live time-series charts for throughput (notifications/s, variants/s), cache growth (entries and size in MB), and health (error rate, thread pool in-flight)
- Processing breakdown tables — by content type (HTML, CSS, JS, Image) with average processing time, and by image format (WebP, AVIF, JPEG, PNG, SVG)
- HTML assembly status — complete, skipped, and CSS-aborted counts
- SSIMULACRA2 quality metrics — checks, re-encodes, and average score
- Content analysis classification — photo, screenshot, illustration, noisy
- Browser analysis section (when
--enable-browser-analysisis set) — Chrome status, profiles generated/used, queue depth, analysis errors, crashes - Bandwidth savings hero card — total bytes saved, percentage reduction, calculated from the live event stream
- Export buttons — download the current stats snapshot as JSON or CSV
All data updates in real time via the /v1/ws/stats and /v1/ws/events
WebSocket streams. An alert banner surfaces issues like rising error rates
or connection saturation.
URL inspector (/urls)
Browse and inspect every URL in the cache.
- Paginated URL list with hostname filter and variant count per URL
- Per-URL status badges — Complete, Partial, Original Only, Revalidating
- Cooldown indicators — shows when a URL is actively being optimized, waiting for retry, or in the CSS revalidation cycle
Click a URL to open the inspector detail view:
- Variants table — every cached alternate listed with its alternate ID, image format, viewport class, pixel density, Save-Data state, transfer encoding, content type, size, SSIMULACRA2 quality score, content class, hit count, and sentinel status. Columns are sortable.
- Expandable row detail — click any row to see the actual cached content inline: image preview, SVG render, HTML/CSS/JS source, or sentinel data (Early Hints URLs, browser profiles)
- Size comparison bars — visual comparison of each variant against the original
- Quality distribution chart — SSIMULACRA2 score distribution across all optimized variants for the URL
- SVG detail panel — when SVG variants exist, shows size reduction, content class, and vectorization pipeline details
- Device simulation — build a capability mask by choosing format, viewport, density, Save-Data, and encoding (or use a device preset), then click “Simulate Selection” to see which alternate the cache selector would serve. The scoring breakdown shows exactly how format match (+1000), viewport (+80), encoding (+60), density (+40), and Save-Data (+20) contribute.
- Actions — Purge (delete all variants), Reprocess (purge + re-queue), Add to Group
- URL Groups — organize URLs into named groups for batch monitoring
- Clear Cache — reset the entire cache volume (with confirmation)
Waterfall viewer (/waterfall)
Network waterfall visualization powered by headless Chrome (requires
--enable-browser-analysis).
- Enter a URL and choose a viewport width (Mobile 480px, Tablet 768px, Desktop 1024px, Wide 1280px)
- Single capture — loads the page and renders a waterfall chart showing every network request with timing bars
- Capture Both — runs two sequential captures: one directly to the origin (baseline) and one through mod_pagespeed (optimized). Displays them side by side.
- Comparison summary bar — transfer size savings, resource count diff, and finish time diff with percentage changes
- Per-resource size delta table — sorted by savings, showing original vs. optimized size for each matched URL
- Export JSON — download the full waterfall data for external analysis
- Link to Visual Diff — jump to the diff page with context
Visual diff (/diff)
Screenshot comparison between original and optimized pages (requires
--enable-browser-analysis).
- Capture Original — screenshot from origin server
- Capture Optimized — screenshot through PageSpeed
- Capture Both — parallel capture for instant comparison
- Three comparison modes:
- Slider — drag a divider to reveal original vs. optimized
- Blink — alternates between the two images on a timer
- Pixel Diff — highlights pixel-level differences
- Zoom controls — Fit, 100%, 200%
- Export — download original and optimized screenshots as PNG
- Capture metadata — URL, viewport dimensions, image sizes
Configuration (/config)
Read and modify the worker’s runtime configuration.
- Export/Import toolbar — export current config as
.pagespeed.json, import from file, or copy non-default settings as CLI flags to clipboard - Config panel — every hot-reloadable setting (image quality, compression levels, viewport widths, SVG parameters, content type toggles, browser analysis flags, security limits) with live editing and Apply/Reset buttons
- Config snapshots — save and restore named configuration snapshots for A/B testing different settings
Changes take effect immediately via PATCH /v1/config. No worker restart
required.
Metrics (/metrics)
Complete flat view of every worker metric.
- Filterable table — every counter and gauge flattened from the stats JSON, grouped by category (Notifications, Variants, Errors, Cache, Processing, Quality, Browser, etc.)
- Descriptions column — explains what each metric means
- Warning highlighting — rows with non-zero error counts are flagged
- Auto-refresh — polls
/v1/statsevery 2 seconds - Export JSON — download raw metrics for Grafana or custom dashboards
Bandwidth savings (/savings)
Dedicated view for optimization impact measurement.
- Summary cards — bytes saved, savings rate, variants written, compression counts, cache size
- Savings by type table — HTML, CSS, JS, Image with count, average processing time, and estimated savings rate
- Image format distribution — WebP, AVIF, JPEG, PNG with count and share
- Measured savings (when event stream is active) — real byte-level comparison of original vs. optimized sizes across all observed variant writes
- Reset button — zero the counters to measure savings over a specific time window
- Export — JSON and CSV
Debug console (/logs)
Real-time log streaming from the worker.
- Source filter — toggle Worker, Cache, Chrome log sources
- Level filter — toggle Debug, Info, Warning, Error
- Search — filter logs by keyword with debounced search
- Auto-scroll with pause/resume and “N new” badge while paused
- Log line details — timestamp, level badge, source badge, module tag (color-coded), message text, and optional JSON details
- Export — download visible logs as TXT or JSON
- Clear — wipe the log buffer
The worker maintains a ring buffer of the last 2,000 log entries. On
connection, the console receives the full buffer snapshot, then streams
new entries via /v1/ws/logs.
About (/about)
System information, support, and legal links.
- Version and uptime
- Support — states that the software is licensed under the Apache License 2.0 and links to where support subscriptions are described
- Legal links — Privacy Policy and Terms of Service (inline overlay or external link)
API connection
The console connects to the worker’s HTTP API using the @pagespeed/api-client
TypeScript package, which offers:
- REST client — typed GET/PATCH/POST calls for every REST API endpoint
- WebSocket streams —
/v1/ws/stats(live metrics),/v1/ws/events(real-time variant write events),/v1/ws/logs(log streaming) - Connection manager — automatic health polling, reconnection with backoff, and connection state tracking
- Auth — Bearer token via first WebSocket message (not query parameter)
When no API token is configured, all endpoints are open. With a token and
--api-read-open, the allow-listed GET endpoints and the stats/events
WebSocket streams are open — except the log stream, /v1/ws/logs, which
still needs the token sent as its first message — while mutating operations
require authentication. The health endpoint (/v1/health) is always
unauthenticated. At most four WebSocket connections from one address may be
simultaneously waiting to send that first-message token before the worker
refuses further upgrades from that address (see
Connection Limits); the console opens
two streams per browser tab, statistics and log, and an authenticated or
read-open-stream connection never counts against that limit.
The console is a self-contained single-page app — it loads no third-party scripts, uses no external UI toolkit, and renders its time-series charts with a lightweight built-in charting library.
Next steps
- HTTP API Reference — Full reference for the REST and WebSocket endpoints the console uses
- Browser Analysis — How headless Chrome powers the waterfall viewer, visual diff, and critical CSS extraction
- Configuration Reference — All worker flags and tuning options available through the config panel
- Production Deployment — Put the worker and console behind nginx and lock the API port down for production
- Troubleshooting — Diagnose issues using the debug console and management socket