mod_pagespeed admin console
Last updated Edit this page View as Markdown
mod_pagespeed 2.1 admin console: alerts, statistics, cache inspection, message history and config, with setup and access control for nginx, Apache and IIS.
On this page
Overview
mod_pagespeed 2.1 includes built-in admin pages for monitoring, configuration inspection, and cache management. Access them at /pagespeed_admin/ on your server.
Two endpoints are exposed: /pagespeed_admin is the per-vhost admin handler, and /pagespeed_global_admin is the process-wide handler. Both are read-write (cache purge) and warrant the same access restrictions in production.
The console heads the optimizer worker’s card on its Overview page “Optimizer daemon”; its sidebar groups the worker’s pages under “Optimizer”. This page keeps those labels where it names the UI and says “worker” everywhere else; the two words mean the same process.
Admin pages
| Page | URL | Description |
|---|---|---|
| Overview | /pagespeed_admin/ (landing page) | Module and optimizer status, savings, and alerts |
| Statistics | /pagespeed_admin/statistics | Filter activity, cache hit rates, latency |
| Configuration | /pagespeed_admin/config | Active filters and directive values |
| Histograms | /pagespeed_admin/histograms | Page load time, rewrite latency distributions |
| Caches | /pagespeed_admin/cache | Cache status, inspection, and purge |
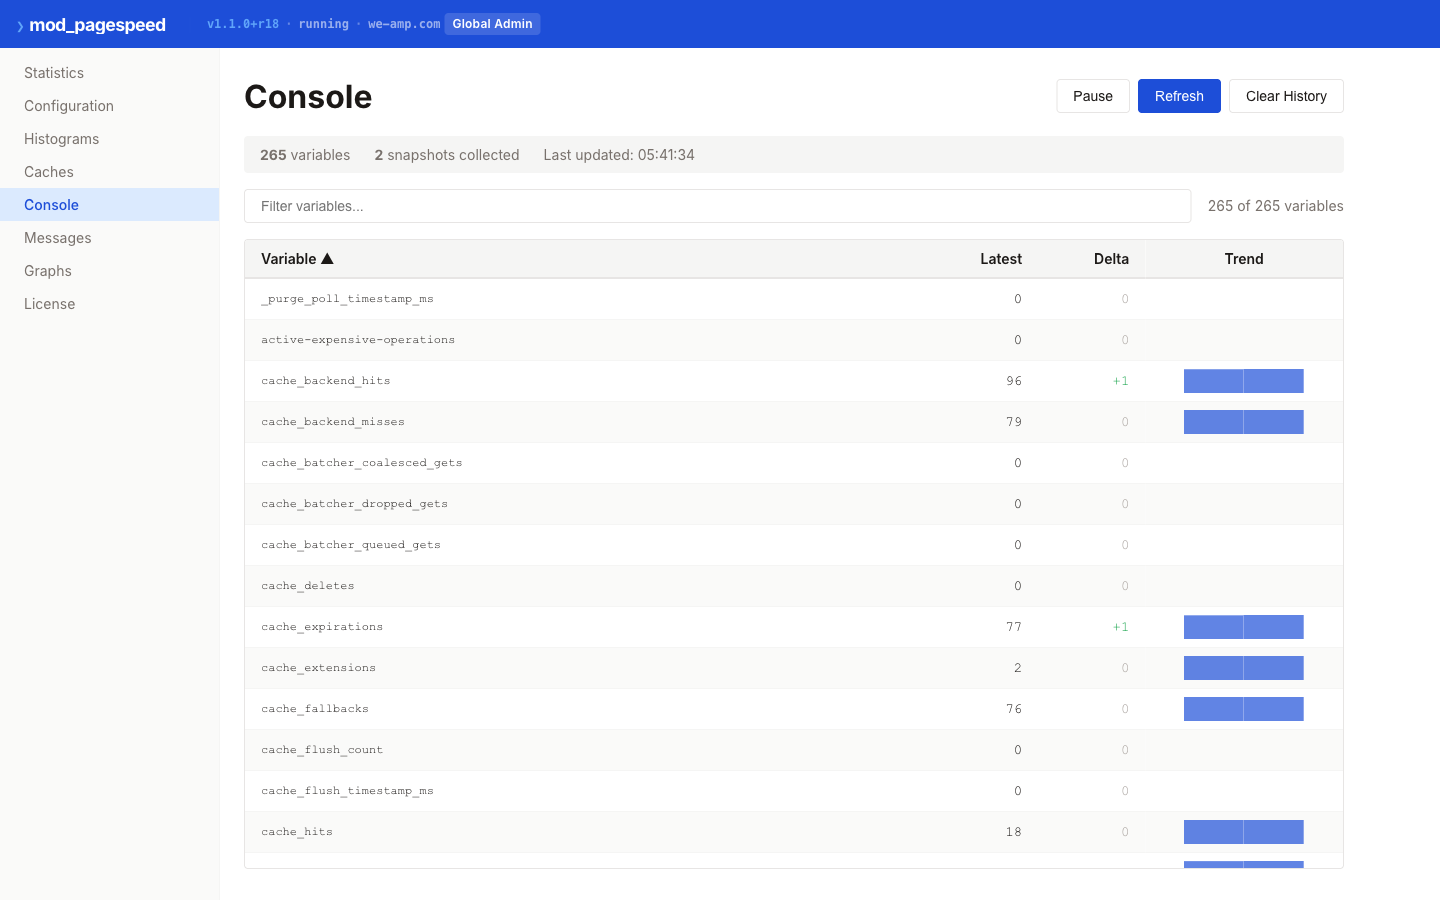
| Console | /pagespeed_admin/console | Historical graphs (requires StatisticsLogging) |
| Messages | /pagespeed_admin/message_history | Recent log messages, filterable by severity |
| Status | (in the sidebar under “Optimizer”) | Optimizer worker health, load and cache on one page |
| About, Support | (in the sidebar under “Help”) | Build/optimizer versions, documentation and legal links |
The console opens on the Overview page by default; the other pages are reached from the sidebar or with a keyboard shortcut.
Setup
Set the handler paths you want, then restrict each of them with nginx location blocks. AdminPath, StatisticsPath, MessagesPath and ConsolePath can be set in a server block. GlobalAdminPath and GlobalStatisticsPath can only be set in the http block, and a path set in the http block is served by every server block, including the default server. Each server block that serves a path needs its restriction; a path set inside one server block needs it in that block only.
http {
    # Process-wide pages: set here, served by every server block.
    pagespeed GlobalAdminPath /pagespeed_global_admin;
    pagespeed GlobalStatisticsPath /ngx_pagespeed_global_statistics;

    server {
        listen 80;
        server_name <your-domain>;

        pagespeed AdminPath /pagespeed_admin;
        pagespeed StatisticsPath /ngx_pagespeed_statistics;
        pagespeed MessagesPath /ngx_pagespeed_message;
        pagespeed ConsolePath /pagespeed_console;

        # Allow localhost only; widen explicitly for ops access
        # (for example `allow 10.0.0.0/8;` before `deny all;`).
        # An admin path takes two blocks: `=` covers the page itself and
        # `^~` every page below it, ahead of any regular-expression location.
        location =  /pagespeed_admin         { allow 127.0.0.1; allow ::1; deny all; }
        location ^~ /pagespeed_admin/        { allow 127.0.0.1; allow ::1; deny all; }
        location =  /pagespeed_global_admin  { allow 127.0.0.1; allow ::1; deny all; }
        location ^~ /pagespeed_global_admin/ { allow 127.0.0.1; allow ::1; deny all; }
        # The other handler paths have no pages below them: one `=` block each.
        location = /ngx_pagespeed_statistics        { allow 127.0.0.1; allow ::1; deny all; }
        location = /ngx_pagespeed_global_statistics { allow 127.0.0.1; allow ::1; deny all; }
        location = /ngx_pagespeed_message           { allow 127.0.0.1; allow ::1; deny all; }
        location = /pagespeed_console               { allow 127.0.0.1; allow ::1; deny all; }
    }

    # Every other server block, including the default server, serves the
    # process-wide pages too and needs their blocks.
    server {
        listen 80 default_server;

        location =  /pagespeed_global_admin         { allow 127.0.0.1; allow ::1; deny all; }
        location ^~ /pagespeed_global_admin/        { allow 127.0.0.1; allow ::1; deny all; }
        location =  /ngx_pagespeed_global_statistics { allow 127.0.0.1; allow ::1; deny all; }
    }
}- An admin path and every page below it are one unit for access control. Give its
=and^~blocks the same rule, and add nolocationblocks for single pages below an admin path. To expose statistics on their own, useStatisticsPath. - Set handler paths without a trailing slash. A path set as
/x/serves/x/and the pages below it, not/x, and takes onelocation ^~ /x/block. - Spell each path exactly as in its directive. Matching is case-sensitive on both sides: nginx never case-folds a path, and the module selects its handlers by exact comparison too.
- Block order does not matter for these paths.
=and^~blocks are chosen ahead of any regular-expression location, such as the one for.pagespeed.resources. - These pages are reached by their own paths only. A request that nginx rewrites (
rewrite) or redirects internally to one of these paths is not served by the admin, statistics, console or message pages.
The nginx packages ship the admin blocks as /usr/share/doc/nginx-module-pagespeed/pagespeed_admin_restrict.conf.sample. It covers the two admin paths (AdminPath and GlobalAdminPath) only; add a location = block for each other handler path you set. Copy it to /etc/nginx/snippets/pagespeed_admin_restrict.conf and include it from every server block, including the default server.
Upgrading from 1.16.0 or earlier: after updating, replace your access rules for these pages with the blocks above, in every server block that serves them. The update does not change rules that are already in your configuration. Enforce the restriction in nginx itself, not in a filter in front of it; see URL-path ACLs are brittle.
Module versions before the one that made the handler lookup case-sensitive (see the changelog’s security entries) matched these paths ignoring case, so a differently-cased path could reach a handler that the blocks above never saw. On such a version, guard the paths with case-insensitive regex locations instead — for example location ~* ^/pagespeed_admin(/|$) { allow 127.0.0.1; allow ::1; deny all; }, placed ahead of your other regular-expression locations, because nginx uses the first regular-expression location that matches — or update.
<Location /pagespeed_admin>
    Order allow,deny
    Allow from localhost
    Allow from 127.0.0.1
    SetHandler pagespeed_admin
</Location>

<Location /pagespeed_global_admin>
    Order allow,deny
    Allow from localhost
    Allow from 127.0.0.1
    SetHandler pagespeed_global_admin
</Location>
Add admin path directives to your pagespeed.config:
pagespeed AdminPath /pagespeed_admin
pagespeed GlobalAdminPath /pagespeed_global_admin
pagespeed StatisticsPath /pagespeed_statistics
pagespeed GlobalStatisticsPath /pagespeed_global_statistics
pagespeed MessagesPath /pagespeed_message
pagespeed ConsolePath /pagespeed_console
By default, admin pages are accessible only from localhost. To allow access from other hosts:
pagespeed InfoUrlsLocalOnly offUse this setting with caution in production — restrict access at the network level (firewall rules) when exposing admin pages to non-local clients.
Windows Event Viewer
The IIS module logs warnings and errors to the Windows Event Viewer automatically. Open Event Viewer and look under Windows Logs > Application for entries from the mod_pagespeed source.
Event Viewer captures module startup/shutdown messages, configuration errors, and runtime warnings without any additional configuration.
Access control
Restrict admin page access by domain using domain-level ACLs:
pagespeed AdminDomains Allow localhost;
pagespeed AdminDomains Allow 10.0.0.*;
ModPagespeedAdminDomains Allow localhost
ModPagespeedAdminDomains Allow 10.0.0.*pagespeed AdminDomains Allow localhost
pagespeed AdminDomains Allow 10.0.0.*On IIS, the InfoUrlsLocalOnly directive provides an additional layer of access control. When set to on (the default), admin URLs are only accessible from the local machine regardless of the AdminDomains setting.
Available ACL directives: StatisticsDomains, GlobalStatisticsDomains, MessagesDomains, ConsoleDomains, AdminDomains, GlobalAdminDomains.
Default is Allow *. Once any Allow is specified, all other domains are implicitly denied. Wildcards are supported.
These directives match the host name of the request, not the address of the client. On nginx, restrict who can reach the admin pages with the location blocks shown under Setup, in every server block that serves them; the domain lists are an additional check.
Overview page
The console opens on the Overview page. It answers three questions at a glance: is the module working, is the optimizer worker healthy, and what have they saved — plus a ranked list of anything that needs attention.
A one-line health summary sits at the top: “All systems healthy”, or “N issue(s) need attention” in warning or error color depending on the worst alert currently active. Below it are two cards:
- Module — bytes saved by optimization (and the percentage of the original size), how much was served from the optimizer’s cache (of the in-place requests it handled), and resource fetch failures (linked to the Messages page filtered to warnings and worse). Before any traffic has been optimized, the card says so instead of showing zeros.
- Optimizer daemon (the console’s label for the worker) — its state (Running, Not configured, Unreachable, Outdated, or Checking — see Optimizer status page for what each one means), version, uptime, and bytes saved on responses it served (with the percentage of the original size). A note appears when all of its worker threads are busy, when its version is older than this console supports, or when its version does not report the statistics needed for savings and alerts.
Both cards link to their detail page (All statistics, Optimizer status).
Alerts
The Overview raises alerts above the cards, ranked with errors before warnings:
| Alert | Severity | Fires when |
|---|---|---|
| Optimizer health check failing | Error | One of the worker’s health checks reports failure |
| Optimizer write failures | Error | The optimizer’s count of failed cache writes increases (usually disk pressure or a permissions problem on its cache volume) |
| Optimizer unreachable | Warning | The worker is configured but not answering |
| Optimizer version | Warning | The optimizer is too old for this console, or too old to report the statistics it reads |
| Optimizer errors | Warning | The optimizer’s error count increases |
| Origin sends compressed responses | Warning | The optimizer received a response it cannot optimize because the origin (or a proxy in front of it) compressed it |
| Module fetch failures | Warning | The module’s resource-fetch-failure count increases; links to Messages |
| Browser analysis stopped | Warning | Browser-based analysis is enabled but the browser is not running (falls back to heuristic analysis) |
| Optimizer threads busy | Warning | Every optimizer worker thread is busy; new work waits |
| Optimizer connections | Warning | Optimizer connections are above 90% of the configured maximum; change notifications from the web server may be dropped |
An alert based on a counter (write failures, errors, fetch failures) fires only on an increase between two refreshes, never on the first sample and never when a counter drops because the optimizer restarted; it then stays visible for about a minute after the last increase so a single event does not flash on and off. An alert based on a state (worker unreachable, threads busy, connections saturated) stays visible for as long as the condition holds. Dismissing an alert hides it until its condition clears and then reoccurs — it does not stay dismissed forever. No optimizer configured raises nothing.
Refresh and connectivity
Each console page keeps one poller: it makes one request at a time, waiting for the previous one to settle before scheduling the next, and refreshes every 5 seconds while things are healthy. After a failed refresh the wait doubles each time, up to a maximum of one minute, and resets to normal once a refresh succeeds again. Nothing is requested while the browser tab is hidden; the page refreshes at once when the tab is shown again. Pages open in more than one tab (or an optimizer panel another tab is already reading) share a read that’s already in flight rather than doubling up — a “busy” answer is not treated as a failure and simply keeps the last view on screen.
The top bar, next to the build version and the vendor link, says connected or reconnecting. This reflects whether the server itself answers at all — a 502/503/504 from a reverse proxy in front of the whole server counts as unreachable, and a request with no answer within 15 seconds counts as unanswered. A 502/503/504 from the optimizer worker’s own proxy endpoints (/v1/daemon/...) does not flip this to “reconnecting” — that’s a state of the optimizer’s own page (see Optimizer status page), not a connectivity problem with the server.
When the server can’t be reached, a banner appears above the page: “Cannot reach the server. The console keeps trying, less often the longer this lasts”, naming when the figures on screen were last refreshed, with a Retry now button. Retry now asks every currently open page’s poller again at once (or, on a page with nothing to poll, does a single configuration read to check). Every page keeps showing its last data through an outage rather than blanking it.
Scope: this host or the whole server
The per-vhost console (/pagespeed_admin/) and the global console (/pagespeed_global_admin/) show different scopes, and the console names which one you’re looking at:
- Overview: “All virtual hosts (the whole server)” on the global console, or “This virtual host (host): separate from other hosts only when per-virtual-host statistics are enabled” on the per-vhost console.
- Statistics: “Aggregate statistics across all virtual hosts (process-wide)” globally, or “Statistics of this virtual host (host) — separate from other hosts only when per-virtual-host statistics are enabled” per vhost.
- Configuration: “Server-wide configuration (all virtual hosts)” globally, or “Configuration of this virtual host (host)” per vhost, and it can show either the server configuration or the options in effect for the current request.
The scope comes from the server’s own configuration, read once when the console loads — not guessed from the URL — so a renamed AdminPath or GlobalAdminPath is still labeled correctly. The host named on a per-vhost console is that virtual host’s own configured name and port; where the server context has no name of its own (the main server on a stock install), the console shows the host name the browser used to reach it instead of a placeholder.
Optimizer savings per site
With an optimizer that reports serve savings per host, the whole-server console lists the optimizer’s savings per site, and a per-host console shows its own site’s figures. Each optimized response is counted under a host name your server configuration lists for the site that served it: the request’s host when it is one of the site’s exact names (ServerName or an exact ServerAlias on Apache, a server_name entry on nginx), otherwise the site’s own primary name. A request that reached a site through a wildcard alias, a regular expression, or because the site is the default one counts under that site’s name; a host name a visitor sends is never listed on its own. A site reached under several exact names has one row per name used, and a per-host console shows the row of the name it was opened under.
On Apache a site is listed under its ServerName only when its configuration states one: a virtual host — or the main server — without a ServerName of its own has its serves counted under “other”, whatever name the server derives for it (requests for one of its exact ServerAlias names still count under that name). The same holds for an nginx server block with server_name _; or with only wildcard and regular-expression names. Give each virtual host its own ServerName to have it listed.
A per-host console sees only its own site’s row, with every other site’s serves added to “other” so the figures still add up, and only its own site’s cache cooldowns; the whole-server console sees every site. On IIS every serve is counted under “other” for now, and IIS and Envoy per-host consoles show no per-site row and list no cooldowns.
Statistics
Statistics are enabled by default and required for features like image rewrite concurrency limiting and background fetch rate limiting. Do not disable them.
pagespeed Statistics on;
pagespeed UsePerVhostStatistics on;
ModPagespeedStatistics on
ModPagespeedUsePerVhostStatistics onpagespeed Statistics on
pagespeed UsePerVhostStatistics onPer-vhost statistics are enabled by default on IIS. Each website gets its own set of counters, accessible at /pagespeed_admin/statistics on that site; site-wide aggregates remain at /pagespeed_global_admin/statistics.
UsePerVhostStatistics enables per-virtual-host stats while still exposing aggregates at the global admin path.
Cache telemetry (v1.15.0+r18)
v1.15.0+r18 adds cache observability counters to the caches page (/pagespeed_admin/cache), reported per Cyclone cache:
- Current entries / Current size bytes — how full the cache is.
- RAM cache bytes / RAM cache hits / RAM cache misses — activity of the optional RAM tier (
CycloneRamCacheKb). - Disk cache hits / Disk cache misses — hit rate of the memory-mapped volume.
- Evictions / Tag collision evictions — entries displaced by capacity pressure or key collisions.
- Write buffer wraps / Wraps deferred by lease / Writes dropped by lease / Wraps forced past lease — write-buffer turnover and how zero-copy serving interacts with it; sustained deferred or dropped counts indicate a cache that is too small for its write rate.
The statistics page also gains counters for zero-copy serving (all 0 while the feature is off): zerocopy_serve_aliased, zerocopy_serve_copied_out, zerocopy_serve_renew_fail_reset, zerocopy_serve_aborted, and zerocopy_serve_ring_refills. A persistently nonzero zerocopy_serve_renew_fail_reset rate is the signal that a cache stripe is hot enough to warrant tuning; see Caching for the zero-copy options.
Optimizer status page
When a server is set up with the optimizer worker (see Caching for DaemonSocketPath and DaemonVolumePath), the sidebar’s “Optimizer” group has a “Status” page for it, titled “Optimizer status”, read through the module’s read-only /v1/daemon/ proxy. The page has three sections:
- Health — the worker’s overall status and ready flag, version, commit, uptime, connections (active of max), and in-flight requests; a table of health checks (each shown as Pass or Fail, with the reason when the optimizer gives one); and — when browser-based analysis is configured — whether the browser is running, its consecutive failure count, and its restart delay.
- Load — how busy the worker is: thread pool (how many of its threads are busy), connections (active of max), notifications received, and the Skipped (duplicate) and Skipped (in-flight) counts, which say how many change notifications from the web server the optimizer did not queue because it had already handled those URLs or was already working on them. The Cache cooldowns table below names each URL the optimizer is holding back, why, and for how much longer.
- Cache — cache entries and cache size, and serve savings per content type, as the module records them: the optimizer itself never answers a page request; the module serves the optimized response from the optimizer’s cache and records it. The section shows responses served, original and served bytes, and the saving for each content type that has traffic, and names the types with nothing recorded instead of listing rows of zeros.
The retired Daemon Status, Daemon Cache and Daemon Back-pressure routes redirect to this page: #/daemon/status opens it, #/daemon/cache its Cache section and #/daemon/back-pressure its Load section, so an old bookmark or documentation link lands on the same page.
The worker is an optional companion, so a section with nothing to show renders an honest empty state rather than an error, naming why:
- not configured on this server — no
DaemonSocketPath/DaemonApiSocketPathis set here; the module optimizes on its own. - unreachable — the worker is configured but the module can’t reach it right now; the module keeps serving pages without it.
- this optimizer version does not provide this panel — an older optimizer build that predates the endpoint this console reads. Update the optimizer package.
None of these states raise the connection banner or flip the top bar to “reconnecting” — only the module’s own web server being unreachable does that. The Overview page’s optimizer card summarizes the same states as Not configured, Unreachable, Outdated, or Checking (transient — the next refresh tries again).
Console (historical graphs)
The console requires StatisticsLogging to record data over time:
pagespeed StatisticsLogging on;
pagespeed LogDir /var/log/pagespeed;
ModPagespeedStatisticsLogging on
ModPagespeedLogDir /var/log/pagespeedpagespeed StatisticsLogging on
pagespeed LogDir %ProgramData%\We-Amp\PageSpeed\LogsThe log directory must be writable by the IIS app pool identity.
Graphs empty states
The Graphs page tells apart three reasons it might have nothing to plot, instead of one generic “no data” message:
- No samples yet —
StatisticsLoggingis on but the server hasn’t logged any samples yet. Graphs appear once it has logged a few (governed byStatisticsLoggingIntervalMs); the Statistics page shows the current counters meanwhile. - No samples in this range — the log has samples, just none in the selected time window; choose a longer range, or check the current counters on Statistics. On the global console specifically, this also means per-virtual-host statistics are enabled: once they are, the whole-server log stops receiving samples and each virtual host’s own console has the graphs instead, with a link to open it.
- No graph data available — this server build or configuration has no graphs endpoint at all; Statistics still shows the current counters.
Message history
Set the message buffer size to enable recent log message viewing:
pagespeed MessageBufferSize 100000;ModPagespeedMessageBufferSize 100000pagespeed MessageBufferSize 100000Messages are collected globally from all IIS worker processes and accessible at /pagespeed_global_admin/message_history.
Default is 0 (disabled).
Filtering by severity
The Messages page has a severity filter — Fatal, Error, Warning, Info — with a live count of each, and shows the most recent messages first. A link of the form #/messages?level=warning opens Messages already filtered to that severity and anything more severe (#/messages?level=error shows fatal and error only, and so on); an unrecognized or missing level shows everything. The Overview page’s fetch-failures figure and its “Module fetch failures” alert both open Messages this way, preset to warnings and worse. The filter is a starting point, not a lock — change or clear it from the page once it’s open (a “Show all” link is always there when a level is preset).
URL-path ACLs are brittle
A WAF, CDN rule or other filter in front of the web server that blocks the admin pages by matching the text of the URL can be bypassed: the filter and the web server do not always read a request as the same path. Restrict access where the web server itself decides which page a request reaches:
- nginx:
location =andlocation ^~blocks for each handler path, in everyserverblock that serves it (see Setup). - Apache: a
<Location>block that carries both the restriction and theSetHandler. - IIS: the module’s own
InfoUrlsLocalOnlycheck (on by default).
A filter in front of the server can add to that restriction, but should not replace it.
Keyboard shortcuts
Press ? (or the ? button in the top bar) to open the shortcut list. None of these fire while typing in a field, or with Ctrl, Alt, or Cmd held, so they never collide with browser or assistive-technology shortcuts.
| Key | Action |
|---|---|
? | Show the keyboard shortcuts dialog |
r | Refresh the current page’s data now (Configuration, About, and Support have nothing to refresh) |
/ | Jump to the page’s search box |
g then o | Go to Overview |
g then s | Go to Statistics |
g then c | Go to Configuration |
g then h | Go to Histograms |
g then a | Go to Caches |
g then m | Go to Messages |
g then g | Go to Graphs |
g then d | Go to Optimizer status |
Esc | Close the shortcuts dialog |
g starts a two-key sequence: press it, then the page’s letter within about a second and a half, or the sequence is dropped.
Accessibility
The console is built to work with a keyboard or a screen reader, not just a mouse:
- Navigation: the sidebar is grouped into Module, Optimizer, and Help; each item is a real link that marks the current page, and a “Skip to content” control leads the tab order. Moving to a new page puts focus on its heading and names the page in the browser tab title. Every interactive control shows a visible focus ring, headings don’t skip levels, and an error that leaves a page empty is announced to assistive technology. If the initial configuration read fails when the console first opens, it’s retried automatically once the connection to the server is next seen restored.
- Tables: sortable column headers (on Statistics and the live snapshot table) are real buttons that announce the current sort order; a histogram can be chosen from the keyboard as well as the mouse.
- Tabs: the Caches page’s views (write-through pairs, shared-memory block size, disk-cache tiers, L1/L2 roles) are proper tabs that work with the arrow keys; on a server where cache purging is off, the purge views are hidden and the page explains how to turn purging on instead.
- Color schemes: both the light and the dark theme meet the WCAG AA contrast ratio for secondary text (timestamps, hints, empty states, table headers), warning and success text, and links — including the Overview page’s “All statistics” and “Optimizer status” links and an alert’s “Details” link, which previously used the browser’s default link color and were too faint against the dark background. Every console page passes an automated accessibility check in both color schemes.
Important notes
pagespeed_adminandpagespeed_global_adminare read-write (can purge cache). Other handlers are read-only.- Always restrict admin page access in production.
See also
- Caching — cache purging via the admin interface
- Configuration — general configuration reference